> ## Documentation Index
> Fetch the complete documentation index at: https://docs.modo.link/llms.txt
> Use this file to discover all available pages before exploring further.
# Developer Dashboard
The Developer Dashboard is the operational workspace inside [**Modo Superapp**](https://app.modo.link/home) for managing subscriptions and monitoring API activity in one place.
Follow platform activity as it happens and keep system behavior visible in real time.
Identify failed calls, response issues, and unusual patterns without leaving the dashboard.
Review every API call in one place with method, status, timing, and request details.
Measure response times and monitor API behavior across different requests and environments.
# Overview
## Plans
This is where access starts.
You see available plans with pricing, limits, and included features. Each plan defines how much data you can use, how fast requests are processed, and what level of support you get.
Current structure:
* **Lite Annual** – basic API access for occasional or personal use
* **Pro Monthly** – full API access with increased rate limits
* **Pro Annual** – full API access with increased rate limits and annual pricing advantage
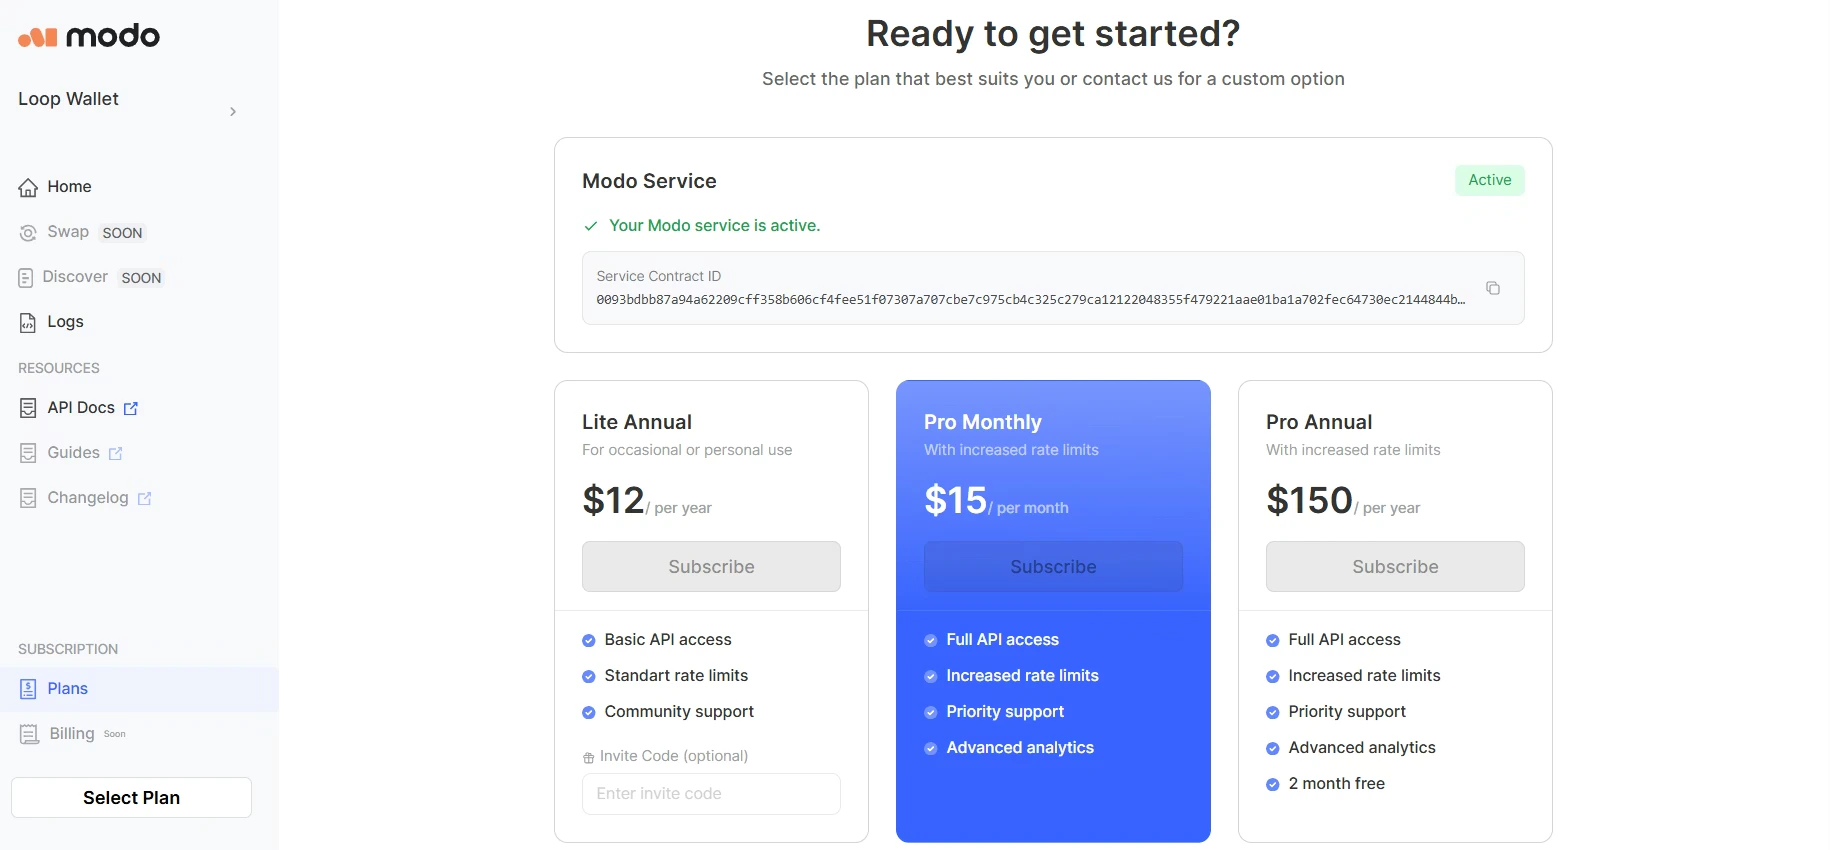 You can activate more than one subscription if one is not enough.
The top block shows service status and contract ID, so you always know whether your access is active.
## Subscriptions
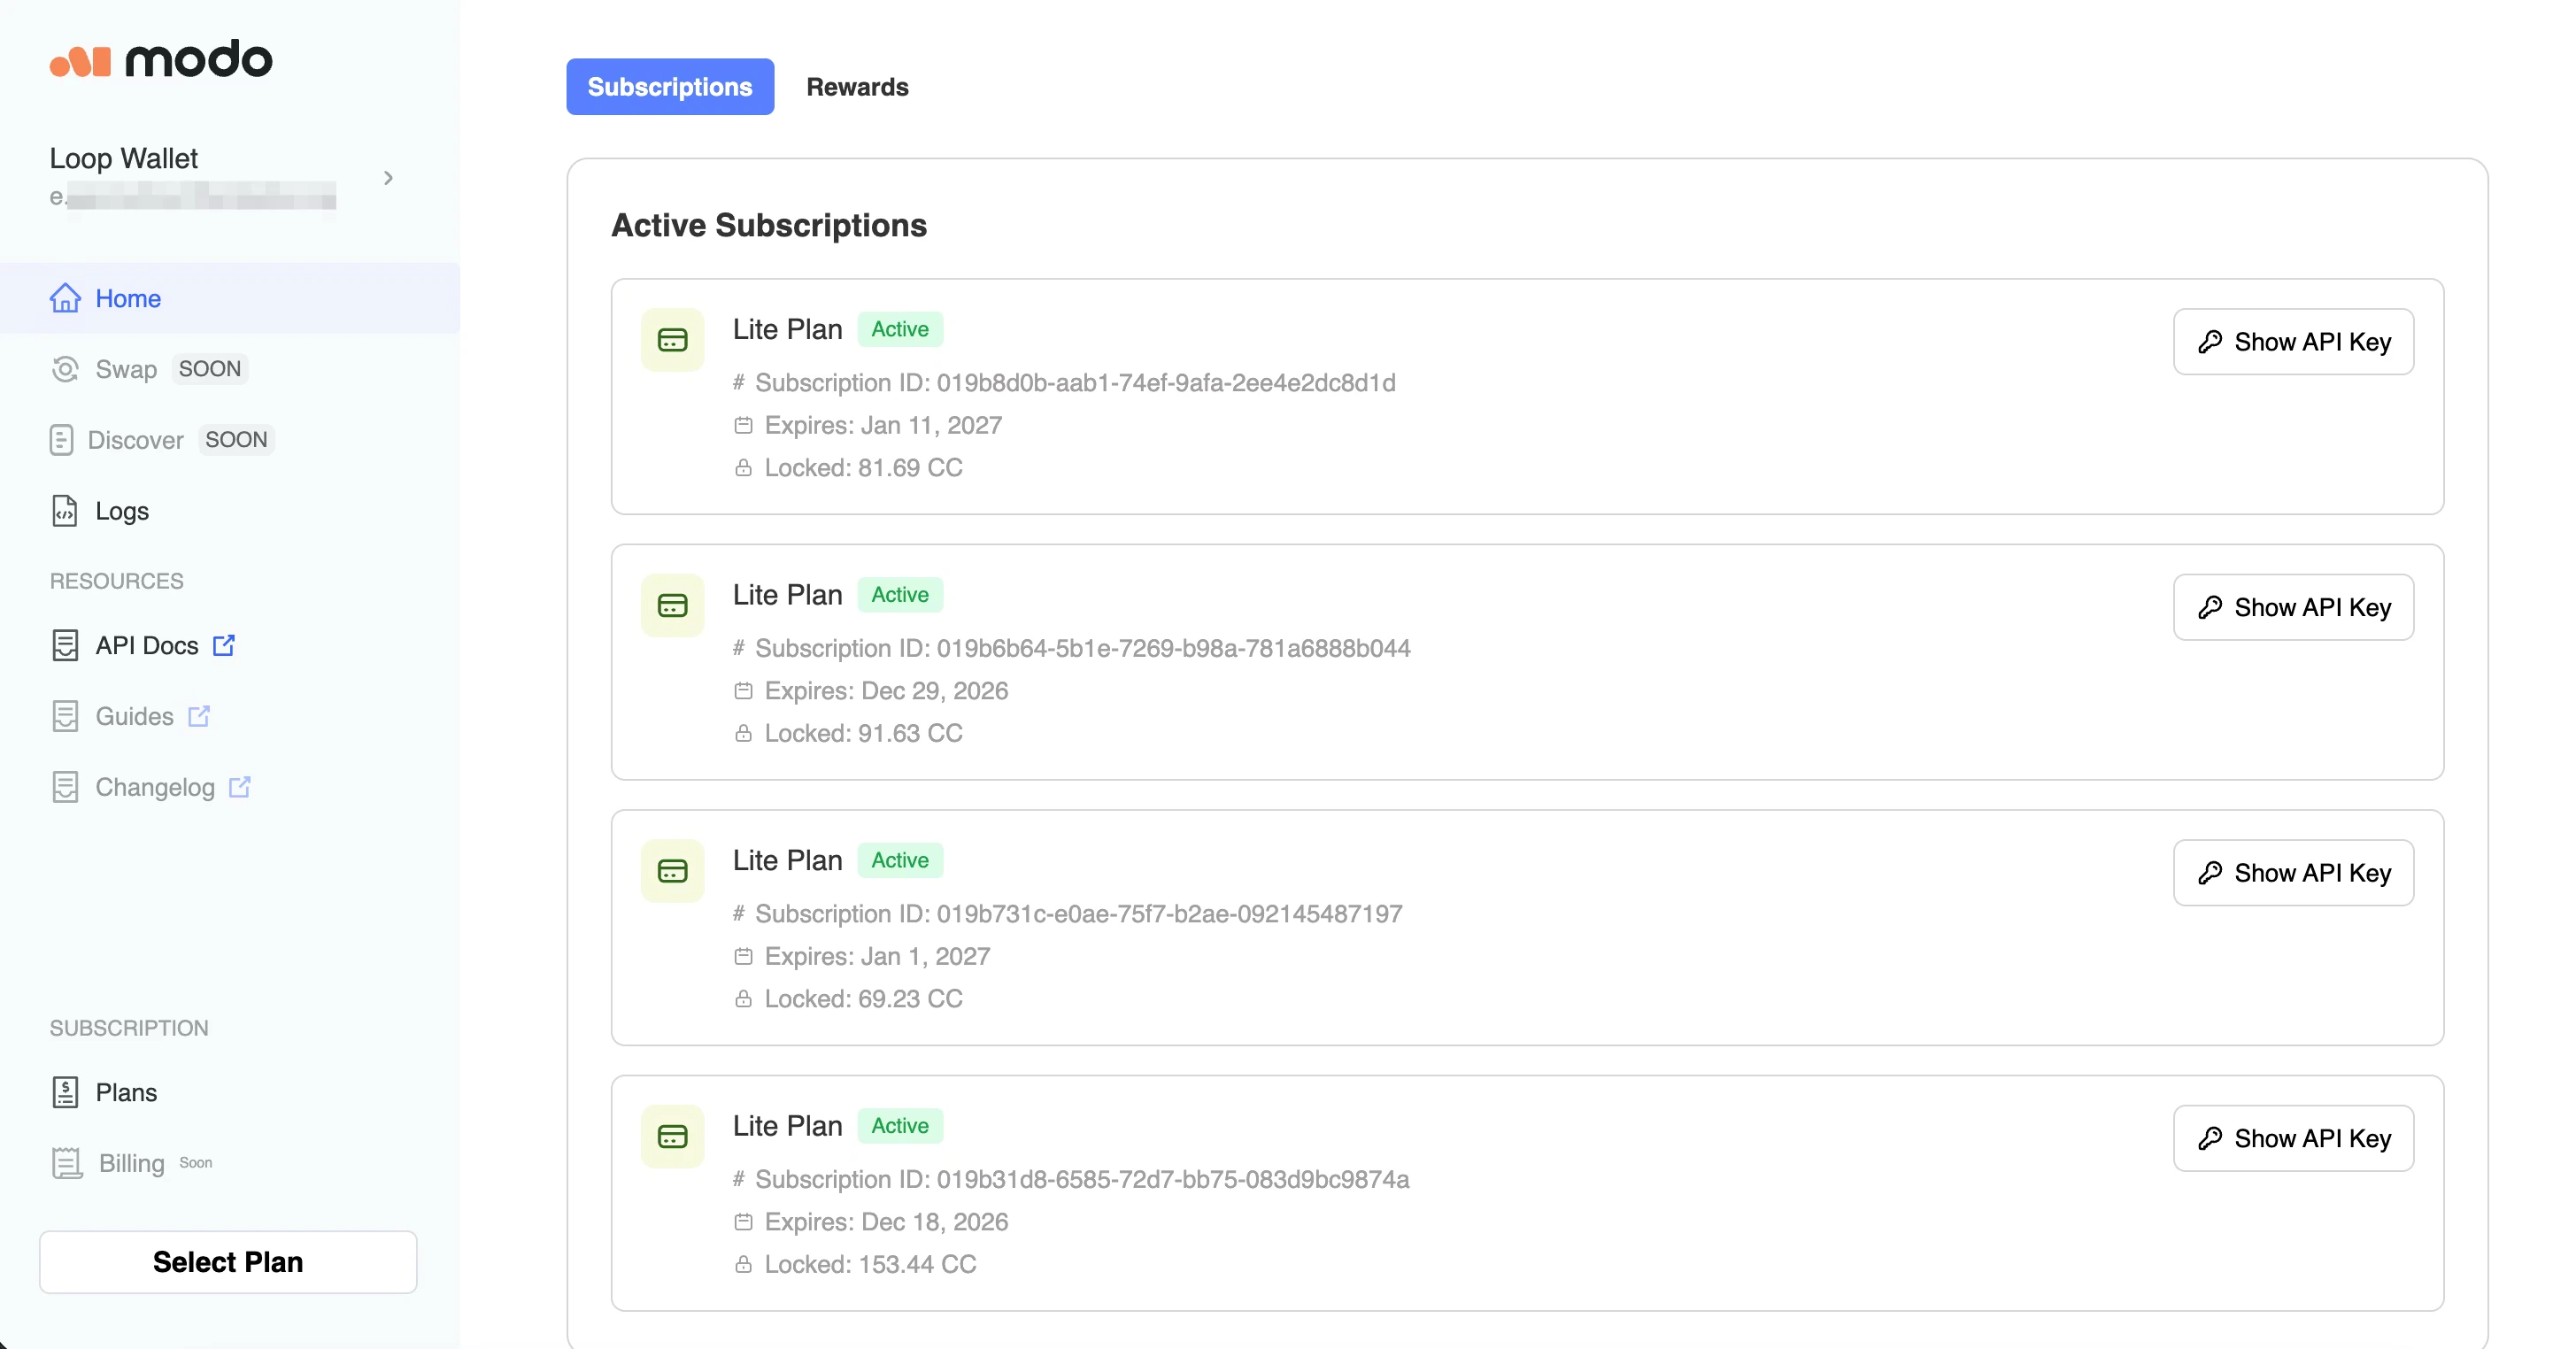
After activation, every subscription appears as a separate unit.
This view is important when you scale usage. Instead of mixing everything together, each subscription stays visible and traceable.
You can activate more than one subscription if one is not enough.
The top block shows service status and contract ID, so you always know whether your access is active.
## Subscriptions
After activation, every subscription appears as a separate unit.
This view is important when you scale usage. Instead of mixing everything together, each subscription stays visible and traceable.
 For a detailed description of how agent subscriptions work, follow [Subscription](/subscription).
## Logs
Logs show what is actually happening.
Every API request is recorded with:
* method name;
* subscription used;
* status and HTTP code;
* response time;
* timestamp;
* chain and network.
For a detailed description of how agent subscriptions work, follow [Subscription](/subscription).
## Logs
Logs show what is actually happening.
Every API request is recorded with:
* method name;
* subscription used;
* status and HTTP code;
* response time;
* timestamp;
* chain and network.
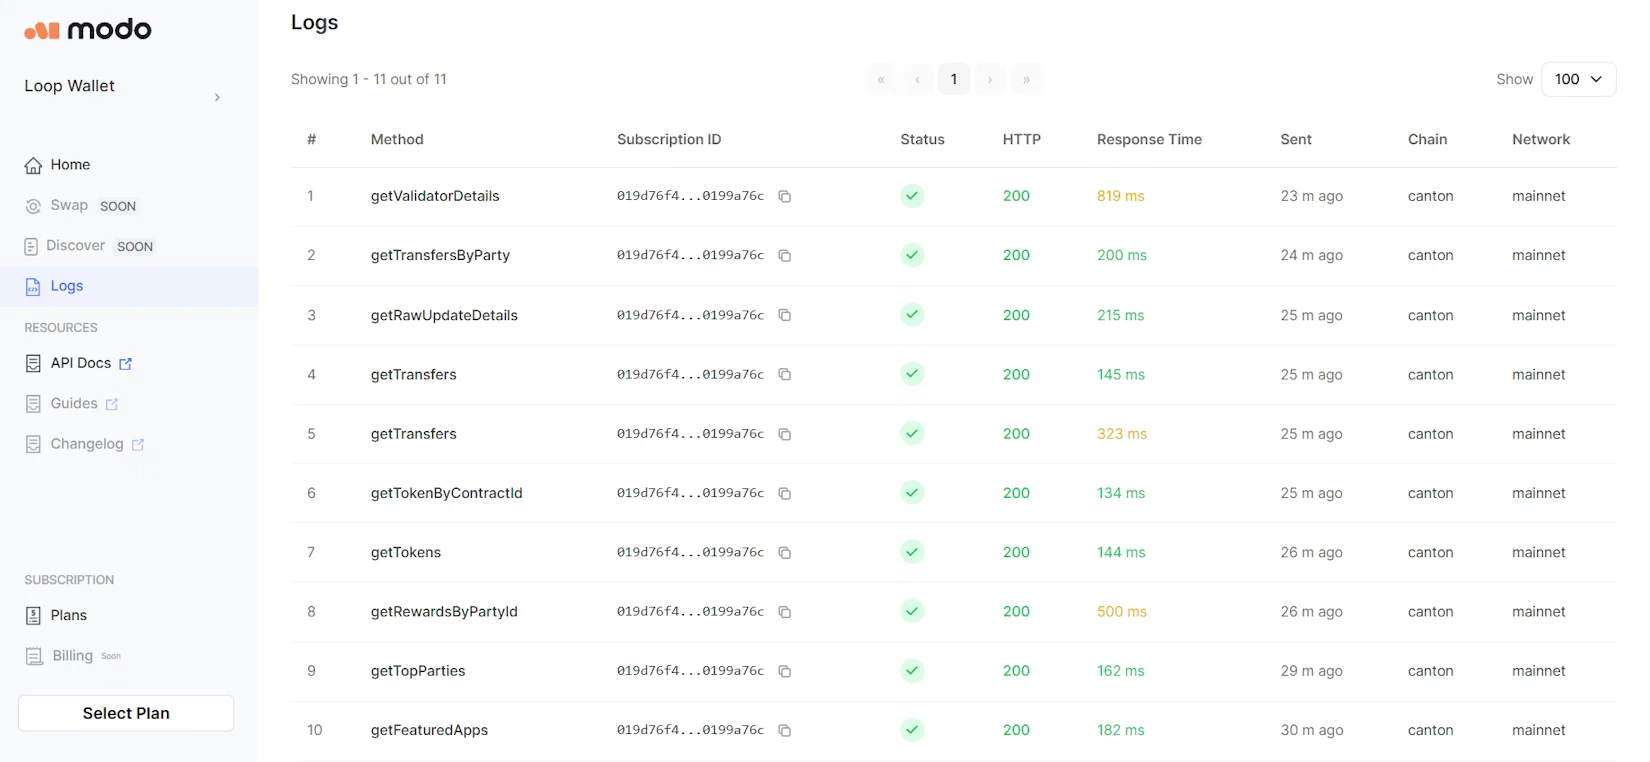 This turns raw activity into a clear timeline.
Logs are the main monitoring layer for development and production.
More powerful monitoring, analytics, and control features are on the way, expanding what you can do inside the Developer Dashboard!
This turns raw activity into a clear timeline.
Logs are the main monitoring layer for development and production.
More powerful monitoring, analytics, and control features are on the way, expanding what you can do inside the Developer Dashboard!